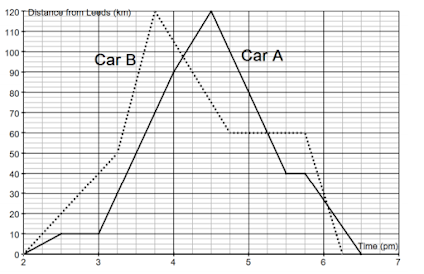
The graph below shows the progress of two cars in a race from Leeds to Blackpool and back again. Car A is the bold line. Car B is the dotted line. Answer the 4 questions below the diagram. 1) How far is it from Leeds to Blackpool? 2) Which car was winning at 3.30pm? 3) Which car was winning at 4.15pm? 4) What was the distance between the cars at 4.45pm?